Increased air pollution is associated with decreased perivascular space volume in older Indian adults
As part of the Neurocognitive Aging and Analytics Research Experience (NAARE) program at California State University, Fullerton, I worked with statistics professor Leon Aksman of USC in a 10-week research project in which I was able to develop my data science and statistical skills.
Background
Perivascular Spaces (PVS), or Virchow-Robin Spaces, are fluid-filled cavities surrounding the brain’s blood vessels that are believed to aid in interstitial fluid and thus metabolic waste drainage. Observable through magnetic resonance imaging (MRI), the expansion or contraction of PVS has been implicated in various neurological conditions including multiple forms of dementia and cerebral small vessel disease (SVD). Due to Perivascular spaces only recently being widely thought to be of importance in detecting neurological conditions, the specific factors influencing the fluctuation in size of PVS is not well understood.Using cross-sectional MRI data from a neuroimaging sub-study of dementia in older Indians (n = 113, aged 60-87), we investigated the associations between dementia risk factors and PVS volume. PVS volume was quantified from T1 and T2 weighted images. We created baseline linear regression models associating PVS volume in white matter (WM) and basal ganglia (BG) regions with age, sex, education, estimated intracranial volume, white matter hyperintensity volume, and regional brain volume. Socioeconomic, lifestyle, environmental, and health-related risk factors were added iteratively, recording each model’s R². We also employed mediation analysis to determine if our predictors were mediating a relationship with the dependent variable or were acting through mediators.
Data Preparation
The data cleaning process involved merging neuroimaging datasets for white matter and basal ganglia PVS volumes, followed by renaming key variables for clarity. Subjects with multiple scans were averaged using a unified BaseID, and only participants present in both imaging and demographic datasets were retained. Clinical dementia ratings were merged in using a unique identifier, and key variables were log-transformed to address skewness. Finally, continuous variables were standardized (z-scored), excluding categorical variables like urbanicity and fuel usage, to prepare the data for downstream analysis.
Methods
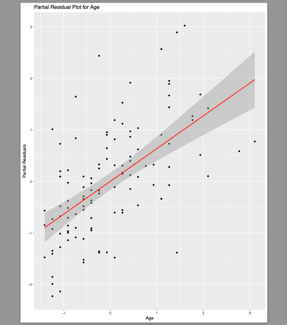
To ensure the validity of linear regression analyses, several diagnostic steps were performed using both graphical and statistical approaches. First, partial residual plots were generated for each predictor variable in models where LOGpvs_bg_vol was the response. Each plot visualized the unique contribution of a predictor after adjusting for other covariates, helping to assess linearity and potential outliers. Variables like Age, Sex, eTIV, and bg_vol were included as core covariates in each model. Plots were created using a custom function and exported to a multi-page PDF for efficient review. The variable Sex was excluded from plotting due to its categorical nature.


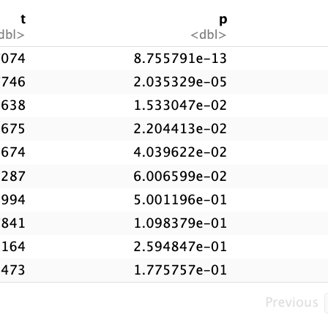
In addition to visual inspection, formal statistical tests were conducted for each predictor using models where LOGpvs_wm_vol was the outcome. For each model, residuals were tested for normality using the KS test. Additionally, Variance Inflation Factor (VIF) values were calculated to identify potential multicollinearity. Variables with a KS test p-value < 0.05 or VIF > 5 were flagged for further scrutiny. The same process was later repeated using LOGpvs_bg_vol as the response variable to ensure that linearity, normality, and multicollinearity assumptions held across both brain regions being studied.
We calculated the additional variance explained (R²) by each variable as the difference between the models explained variance and the baseline model’s explained variance. All reported p-values were corrected for multiple comparisons using the Benjamini-Hochberg procedure, implemented with the ‘p.adjust’ function from the ‘stats’ R package, with the ‘method’ parameter set to ‘BH’. The variables that were significant after multiple corrections (p < 0.05) were considered for mediation analysis. This analysis was replicated for models with either the response variable of cortex volume or the response variable of hippocampus volume. In these two models, the control variables were age, sex, and estimated total intracranial volume.


The single mediation model was used for mediation analysis.
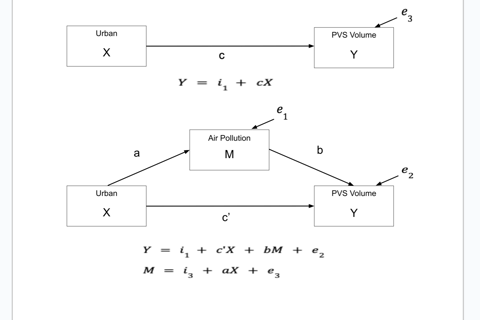
Assumptions of multiple linear regression were checked as previously described before analyses were carried out. The independent variable was urbanicity, which was coded as “1” if the patient resided in an urban setting, and “0” if they resided in a rural setting. The dependent variable was the log-transform of the white matter perivascular space volume, and the mediator was air pollution, which refers to particulate matter less than 2.5μm in diameter, and which was recorded in picograms per milliliter in 2016 from satellite imaging. All regression equations included the same control variables in order to ensure consistency in the interpretation of the results. Because mediation paths assume a causal relationship, we hypothesized that urbanicity leads to increased air pollution, which leads to decreased perivascular space volume. We calculated 95% confidence intervals for our mediated effect. Also, as estimates of the proportion mediated are highly suggested in reporting the mediation effect, we created 95% confidence intervals of the proportion of the relationship between the independent and dependent variables that is mediated by the mediator. We achieved this by generating 10,000 bootstrap samples for the an and b paths and calculating the product of an and b each time to get 10,000 indirect effects. We also generated 10,000 bootstrap samples for the total effect, or c, and divided the indirect effect values by the total effect values for each sample so as to calculate 10,000 estimates for the mediated proportion. Using these samples, we calculated the 95% confidence intervals using the 2.5% and 97.5% quantiles.


Results
For our models predicting perivascular space volume, air pollution (PM2.5) and urban/rural status were the only variables to retain significant p-values (p < 0.05) in white matter after adjusting for multiple comparisons. In the models with hippocampus and cortex volume as the response variables, no variable explained a significant (p < 0.05) amount of additional variance. For our PVS models, air pollution explained the most additional variance, at 28% (p < 0.001). Urban/rural living status explained 12% (p < 0.05) additional variance. The spearman’s correlation coefficient between air pollution and urban/rural status was 0.40. One standard deviation increase in air pollution led to a 0.55 standard deviation increase in white matter perivascular space volume.


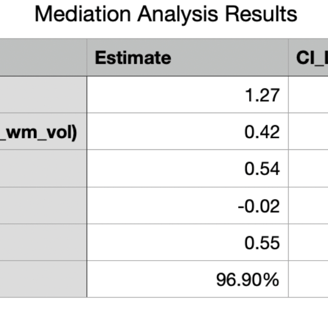
Mediation analysis showed air pollution mediated the association between urban/rural status and PVS volume. The coefficient pertaining to the mediated effect was 0.54 ( 95% CI: 0.37 - 0.75, seed = 123) in the white matter. Converting this to the proportion mediated, we get 97% ( 95% CI: 93% - 100%).
Conclusion
Our results are consistent with the hypothesis that neuroinflammation plays a mediatory role in the relationship between air pollution levels and perivascular space volume, where we hypothesize that the reason increased air pollution leads to increased perivascular space volume is because increased air pollution leads to increased neuroinflammation, which leads to increased perivascular space volume. As India is consistently identified as one of the global leaders in air pollution, our study is particularly relevant in assessing the risks of air pollution on human health. Future research should explore this potential mediatory relationship in order to better understand the mechanisms by which air pollution affects perivascular space volume. Our study helps reduce the ambiguity of what causes perivascular space volume increase, revealing that Urban living leads to increased perivascular space volume through air pollution increase. Our study is the first to find these relationships in older Indian adults and is the first to find a direct link between increased air pollution and increased perivascular space volume in an older (n>=65) population.
